
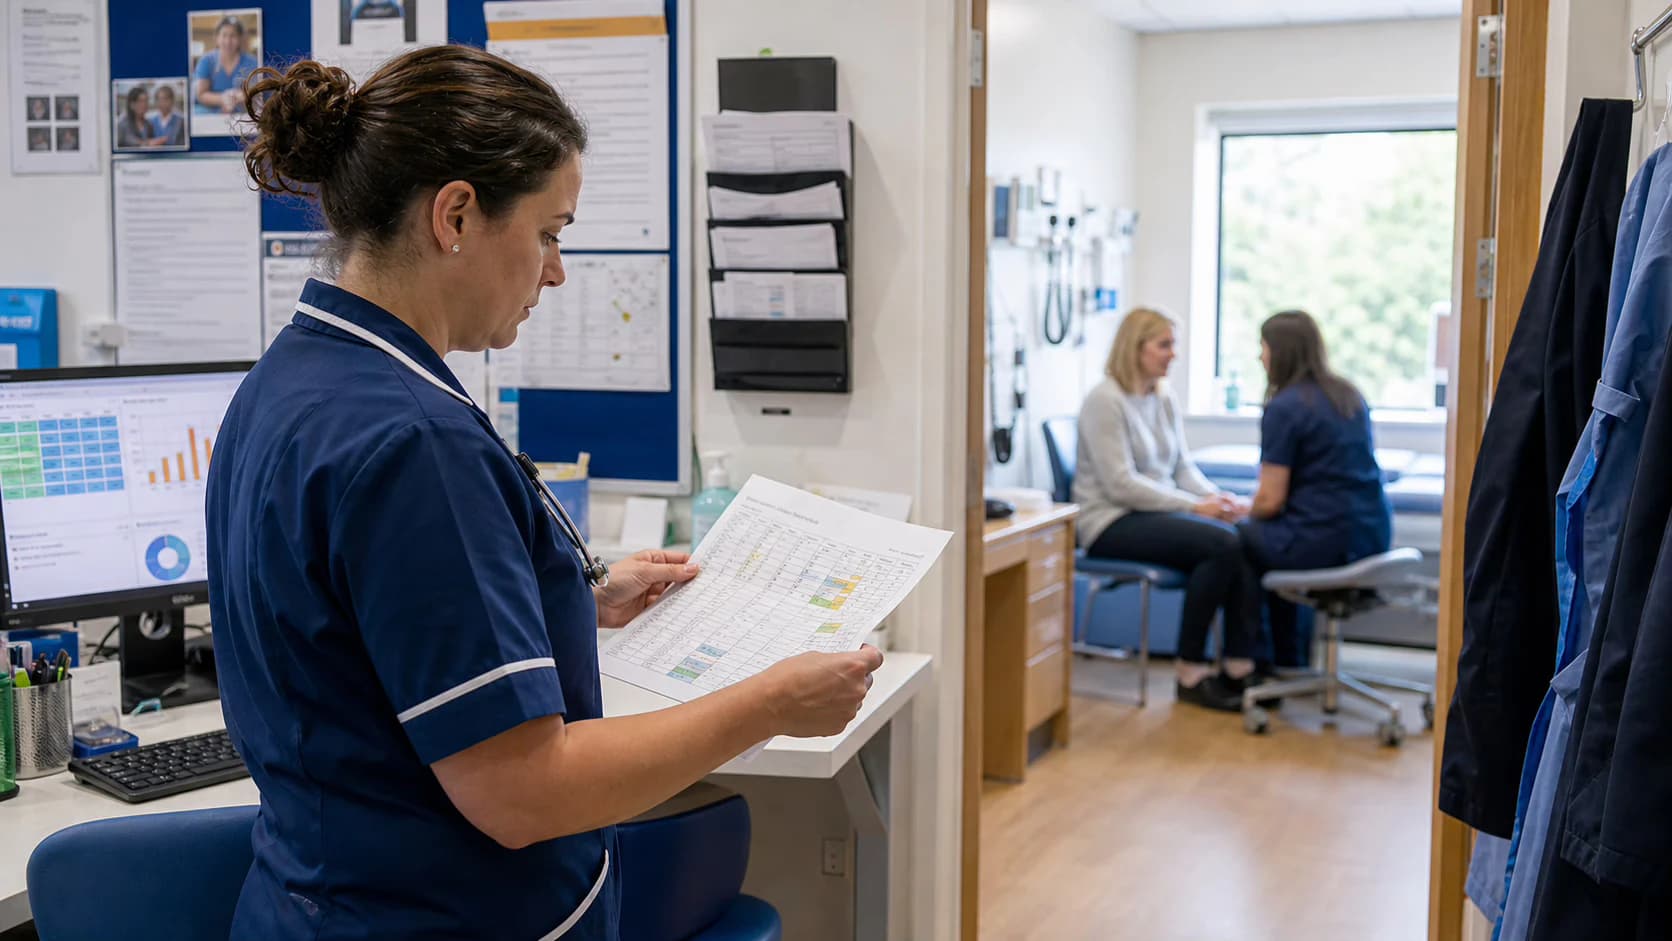
What the June snapshot records
England had 18,156.55 full time equivalent nurses recorded across general practice and primary care networks on 30 June 2026. NHS England publishes the rounded figure as 18,157. The comparable total for June 2025 was 17,760.78, an increase of 395.77 full time equivalents or 2.2 per cent. That is real growth in the recorded total, but it is not a count of individual nurses and it should not be translated directly into extra appointments. Full time equivalent measures contracted working time, while access also depends on skills, deployment, absence, supervision, premises and the needs of the population served.1, 2
The release combines two connected settings. General practices reported 17,077.16 full time equivalent nurses and primary care networks reported 1,079.39. Staff can work across organisational boundaries, and the publication is designed to give a fuller view of the workforce supporting primary care. It still represents a monthly position rather than every hour delivered during June. A person working half of standard full time hours contributes about 0.5 to the total. Headcount, retention and vacancy questions therefore need different tables and should not be inferred from this measure alone.1, 2
The figures were published on 13 August, six weeks after the reference date. They come from the National Workforce Reporting Service, with additional data used for some direct patient care roles. NHS England reports that 6,127 of 6,149 practices supplied valid data, equivalent to 99.64 per cent. Among primary care networks, 1,271 of 1,298 supplied valid data, or 97.92 per cent. High coverage makes the national snapshot useful, but coverage is not the same as perfect completeness within every record or every staff group.1, 2
This distinction matters because workforce releases can acquire a meaning they were not designed to carry. The total does not measure clinical outcomes, appointment length, continuity, workload intensity or how many patients could not obtain care. It also does not show whether growth occurred where need was greatest. It is best read as a structured account of recorded staffing capacity at one date. Local leaders then need activity, population, skill mix and staff experience evidence before deciding whether their service has become more resilient.1, 2
The role mix is changing
The largest category remained practice nurses, with 11,229.39 full time equivalents in June 2026. That was 17.85 lower than the 11,247.24 recorded a year earlier, a change of minus 0.2 per cent. Advanced nurse practitioners increased from 4,515.76 to 4,613.45, a rise of 97.69 or 2.2 per cent. Other recorded nursing roles, including specialist and extended roles, account for the rest of the total. The picture is therefore not one of uniform expansion. Overall growth sits alongside a broadly flat core practice nurse category and a modest rise in advanced roles.2, 3
A newly collected enhanced practice nurse category illustrates why a table should not be read without its notes. The category rose from 58.90 full time equivalents in June 2025 to 213.76 in June 2026. That percentage change looks dramatic, but NHS England identifies enhanced practice nurses as a recently introduced role field. Some of the rise may reflect improved classification or staff moving from a broader category rather than more than 150 newly recruited nurses. Nurse consultants were also added as a separate category and accounted for less than one full time equivalent in the June figures.2, 3
Role labels matter operationally because they describe different scopes, preparation and service functions. An advanced nurse practitioner is not a substitute unit that can simply be exchanged for a practice nurse, and the reverse is also true. Practices need enough capacity for long term condition reviews, immunisation, wound care, prevention, urgent assessment, supervision and leadership. A higher total can still conceal pressure if growth is concentrated in work that does not cover a local gap. It can also conceal progress if a developing role allows a team to provide more complex care safely.2, 3
The national dataset does not adjudicate those local questions. It can prompt them. Boards and primary care networks should examine whether changes reflect planned service development, recruitment difficulty, retirement, reclassification or a transfer of work between organisations. They should also check whether job titles match actual scope and governance. A workforce dashboard that celebrates total growth without testing the role mix may miss a weakening service. One that treats every new role as dilution may equally overlook valuable capability and career progression.2, 3
Data quality changes the interpretation
NHS England estimates missing general practice workforce information where its method permits. In June, 3.65 per cent of the general practice nurse full time equivalent total was estimated. Estimation improves the usefulness of a national series when a small number of practices do not provide complete information, but an estimate is not an observed staff return. Users comparing a small area or a short period should check the data quality statement and avoid presenting an estimated difference as a confirmed recruitment or loss event.1, 3
The treatment of primary care network data is different. The methodology says missing contracted hours are not estimated for individual network staff, and a missing whole staff group is not filled in. This means apparently precise comparisons can be influenced by whether organisations completed each field. Network workforce may also support services beyond the traditional practice setting. Adding practice and network figures gives a helpful system view, but it does not mean every reported hour is available for routine appointments at a patient's registered practice.1, 3
The publication also excludes some settings, including prisons, military bases, educational establishments and specialist care centres. It is therefore not a census of every nurse providing first contact or community facing care. Separately commissioned services may sit outside the return. The boundary should be stated when the total is used in public discussion, particularly if it is compared with demand across the whole population. A narrower data definition is not a flaw, but failing to describe it can turn a valid statistic into a misleading claim.1, 3
Seasonality is another reason to favour like for like annual comparison over a single monthly movement. Staffing changes around training, leave, retirement and recruitment cycles. NHS England's methodology supports comparisons across consistent reporting periods and warns users to understand revisions and changes in collection. The 2.2 per cent annual rise is more defensible than a story built around a small change since March. Even the annual comparison should remain descriptive because the release does not establish why the change occurred.1, 3
What the figures cannot tell patients
Patients experience primary care through timeliness, continuity, communication and whether the professional they see can meet their need. None of those outcomes is directly measured here. An additional full time equivalent can improve access, but the effect depends on where that time is placed and what work it supports. Population growth, ageing, deprivation and shifts from hospital care can raise workload faster than workforce totals. It is therefore unsafe to say that a 2.2 per cent staffing increase means access improved by the same amount.1, 4
NHS England's medium term planning framework asks systems to improve access and reduce unwarranted variation. Workforce is one input to that objective, not its proof. A useful local account would place nurse full time equivalents alongside demand, completed contacts, waiting time, continuity, staff turnover and patient experience. It would separate routine, urgent and proactive care. It would also show whether clinicians have administrative support, protected development time and access to appropriate rooms and equipment. Otherwise a nominal increase can be absorbed by unmet need without becoming visible to patients.1, 4
Productivity language needs particular care in nursing services. More contacts per shift can represent an efficient pathway, or it can represent shorter appointments, delayed documentation and work carried into unpaid time. Complex reviews may appropriately take longer than transactional tasks. A national workforce number cannot resolve that difference. Measures should protect safe clinical judgement and include quality indicators, escalation and staff wellbeing rather than rewarding volume in isolation. Nurses should be involved in deciding which local measures accurately describe their work.1, 4
The same caution applies to comparisons between areas. A network serving a younger population in compact premises has a different workload from a rural network with travel, frailty and poor transport. Recorded staffing may sit in a hosted service and support several places. Crude rankings risk labelling teams without accounting for context or reporting completeness. Comparisons are most useful when they lead to a specific question about need, access or capability, followed by local validation rather than an assumption that the highest or lowest figure explains performance.1, 4
Questions for nursing and system leaders
The first question is whether the local nursing establishment matches the work that patients now require. Leaders should map routine and advanced activity, identify tasks that have moved from hospitals or other services, and check whether funded hours can actually be recruited. Vacancies, temporary cover and turnover need to sit beside the establishment. Full time equivalent figures alone do not show the fragility created when a small number of experienced staff hold essential knowledge, supervision and prescribing responsibility.2, 3, 4
The second question is whether role development is being governed well. Growth in advanced and enhanced practice should be accompanied by clear capabilities, educational support, supervision, indemnity and routes for escalation. Job titles should not be used to stretch a person's scope beyond their preparation. Equally, nurses working at an advanced level should be recognised and supported rather than left in ambiguous posts. The workforce table can reveal a change in labels, but local assurance must establish what those labels mean in practice.2, 3, 4
The third question concerns the core practice nurse workforce. A nearly unchanged national total is not evidence of crisis in every area, but it deserves attention because these nurses provide a large share of planned prevention and long term condition care. Services should review age profile, retirement intentions, training placements and progression routes. Expanding advanced practice without a sustainable route into and through general practice nursing can create a narrow senior layer above an overstretched base. Development plans need entry, consolidation and leadership opportunities as well as new titles.2, 3, 4
Finally, data collection should be treated as part of workforce stewardship rather than a remote reporting task. Accurate contracted hours, role codes and working patterns affect local decisions and national policy. Organisations need a named process for validation and for correcting anomalies. Staff should understand how their information is used and how confidentiality is protected. Better data will not create capacity, but poor data can send investment and attention away from the places that need them.2, 3, 4
A modest rise with an important warning
The June release provides grounds for measured optimism. Recorded primary care nursing capacity increased over the year, and advanced nurse practitioner capacity also rose. It does not support a simple claim that every part of the service expanded. The largest practice nurse category was essentially unchanged, while some striking movements occurred in newly collected role fields. The correct headline is a modest overall rise within a changing and partly reclassified workforce, not a universal improvement.1, 2, 3
For nurses, the data can strengthen a local case when it is paired with workload and quality evidence. A team whose staffing has not kept pace with population need can show that gap directly. A service developing advanced roles can demonstrate the governance and outcomes around that investment. Both uses are stronger than relying on the national percentage alone. The release supplies a benchmark and a common language, while the meaningful decision remains local and clinical.1, 2, 3
For patients and the public, transparency requires saying what is counted. These are full time equivalent positions recorded at a single date across general practice and primary care networks, with some estimation and stated exclusions. They are not the number of nurses, the number of appointments or a verdict on access. Explaining those boundaries does not make the statistics less valuable. It makes them usable without creating expectations the evidence cannot meet.1, 2, 3
The next quarterly release should be read for sustained direction, not a dramatic month to month score. The most important follow up is whether services can retain the nurses they have, develop the right mix safely and convert staffed time into accessible, continuous care. National growth is welcome. The practical test is whether the people doing the work and the patients seeking care can feel a durable improvement in their own service.1, 2, 3

Comments
Loading published comments
Preparing the comment form